MultiModalR performs Bayesian mixture modeling for multimodal data. It detects subpopulations and assigns probabilistic memberships using two advanced Markov Chain Monte Carlo (MCMC) algorithms implemented in optimized C++:
Rcpp, RcppArmadillo, dplyr, furrr, future
# devtools::install_github("DijoG/MultiModalR")
install.packages("MultiModalR", repos = c('https://dijog.r-universe.dev', 'https://cloud.r-project.org'))
When to use: Categories are independent and should not share information. Each category gets its own separate mixture model.
library(MultiModalR)

# Load data
df <- MultiModalR::multimodal_dummy

# Run stratified analysis (parallel)
results <- fuss_PARALLEL_mcmc(
  data = df,
  varCLASS = "Category",
  varY = "Value",
  varID = "ID"
)

# View results summary
summary(results)
When to use: Categories share the same underlying components (same K) but may have different means, variances, and weights. Borrows information across categories, making it more stable for small categories.
# Run hierarchical model
result <- fuss_COVARIATE_mcmc(
  data = df,
  varY = "Value",
  varCLASS = "Category",
  K = 3,                    # Auto-detected if NULL
  n_iter = 10000,
  burnin = 2000
)

# View results
summary(result)
plot(result)
head(result$prob_matrix)

# Check convergence
MultiModalR::check_convergence(result)
MultiModalR::fuss_PARALLEL_mcmc(
  data = df,                  # 📦 -> required
  varCLASS = "Category",      # 🏷️ -> required
  varY = "Value",             # 📈 -> required
  varID = "ID",               # 🆔 -> required
  method = "sj-dpi",          # 📏 /default
  within = 1,                 # 🎯 /default
  maxNGROUP = 5,              # 🔢 /default
  out_dir = ".../output",     # 💾 -> optional
  n_workers = 3,              # ⚡ /default
  n_iter = NULL,              # 🔄 /default
  burnin = NULL,              # 🔥 /default
  proposal_sd = 0.15,         # 📊 /default
  sj_adjust = 0.5,            # ⚖️ /default
  mcmc_method = "metropolis", # 🧮 /default
  dirichlet_alpha = 2.0       # 🎲 /default
)
MultiModalR::fuss_COVARIATE_mcmc(
  data = df,                  # 📦 -> required
  varY = "Value",             # 📈 -> required
  varCLASS = "Category",      # 🏷️ -> required
  varID = "ID",               # 🆔 -> optional
  K = NULL,                   # 🔢 auto-detected
  n_iter = 10000,             # 🔄 /default
  burnin = 2000,              # 🔥 /default
  proposal_sd = 0.15,         # 📊 /default
  adaptive = TRUE,            # 🧠 /default
  alpha0 = 3.0,               # 📐 /default
  beta0 = 2.0,                # 📐 /default
  alpha_dirichlet = 5.0,      # 🎲 /default
  method = "sj-dpi",          # 📏 /default
  sj_adjust = 0.5,            # ⚖️ /default
  within = 1.0,               # 🎯 /default
  seed = 123                  # 🎲 /default
)
library(MultiModalR)
library(ggplot2)
library(dplyr)

# Load the built-in dataset
df <- MultiModalR::multimodal_dummy

# View the data structure
head(df)
str(df)
library(ggplot2)

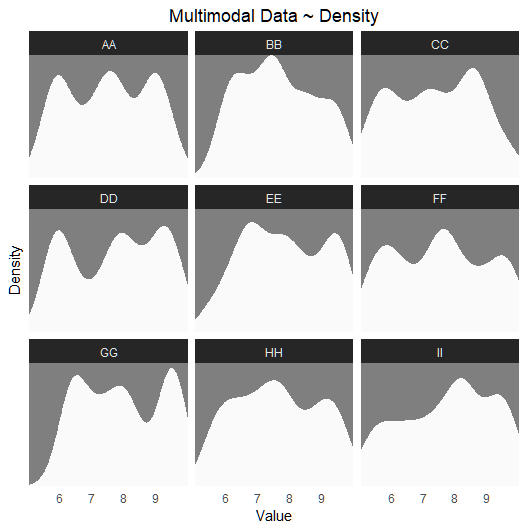
# Plot 01 ~ subpopulations/subgroups not shown
ggplot(df, aes(x = Value)) +
  geom_density(color = NA, fill = "grey98", adjust = .8) +
  facet_wrap(~Category) +
  theme_dark() +
  labs(title = "Multimodal Data ~ Density",
       x = "Value", y = "Density") +
  scale_y_continuous(expand = expansion(mult = c(0, 0))) +
  scale_x_continuous(expand = expansion(mult = c(0, 0))) +
  theme(legend.position = "top",
        axis.text.y = element_blank(),
        axis.ticks = element_blank(),
        panel.grid.major = element_blank(), panel.grid.minor = element_blank(),
        plot.title = element_text(hjust = .5))
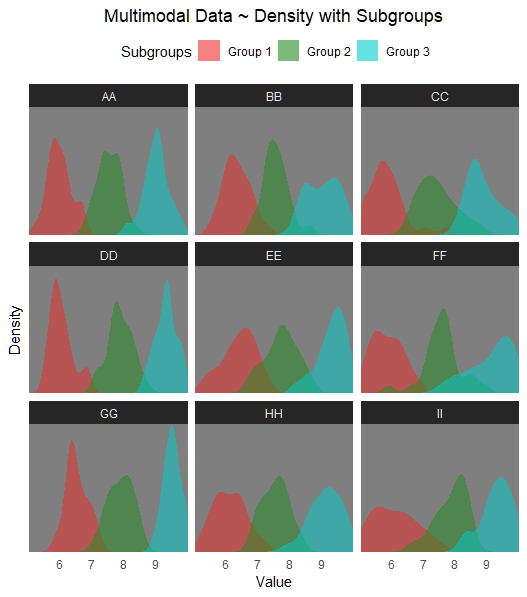
# Plot 02 ~ subgroups shown
ggplot(df, aes(x = Value, fill = Subpopulation)) +
  geom_density(alpha = 0.5, color = NA) +
  scale_fill_manual(values = c("firebrick2", "forestgreen", "cyan3"),
                     name = "Subgroups") +
  facet_wrap(~Category) +
  theme_dark() +
  labs(title = "Multimodal Data ~ Density with Subgroups",
       x = "Value", y = "Density") +
  scale_y_continuous(expand = expansion(mult = c(0, 0))) +
  scale_x_continuous(expand = expansion(mult = c(0, 0))) +
  theme(legend.position = "top",
        legend.key = element_rect(fill = "transparent", color = NA),
        axis.text.y = element_blank(),
        axis.ticks = element_blank(),
        panel.grid.major = element_blank(), panel.grid.minor = element_blank(),
        plot.title = element_text(hjust = .5)) +
  guides(fill = guide_legend(override.aes = list(alpha = .6)))
# Run stratified model with parallel processing
cores <- 3

results <- fuss_PARALLEL_mcmc(
  data = df,
  varCLASS = "Category",
  varY = "Value",
  varID = "ID",
  out_dir = "D:/test/MMR_strat",
  n_workers = cores
)

# View results
head(results)
# Run hierarchical model with auto CSV output
result <- fuss_COVARIATE_mcmc(
  data = df,
  varY = "Value",
  varCLASS = "Category",
  K = 3,
  out_dir = "D:/test/MMR_hier",
  n_iter = 10000,
  burnin = 2000,
  proposal_sd = 0.12
)

# View results
summary(result)
plot(result)
head(result$prob_matrix)

# Check convergence
ess <- check_convergence(result)
The stratified model fuss_PARALLEL_mcmc() generates:

A Data CSV file consists of the following fields (maxNGROUP = 5):
y: Original/observed valueGroup: Original/observed subgroupGroup_1: Predicted belonging probability toGroup_2: Predicted belonging probability toGroup_3: Predicted belonging probability toGroup_4: Predicted belonging probability toGroup_5: Predicted belonging probability toAssigned_Group: Assigned/predicted subgroupMin_Assigned: Minimum value of the assigned/predicted rangeMax_Assigned: Maximum value of the assigned/predicted rangeMean_Assigned: Mean value of the assigned/predicted rangeMode_Assigned: Mode of the assigned/predicted rangeMain_Class: Category/main group/classThe hierarchical model fuss_COVARIATE_mcmc() outputs a list with many components.
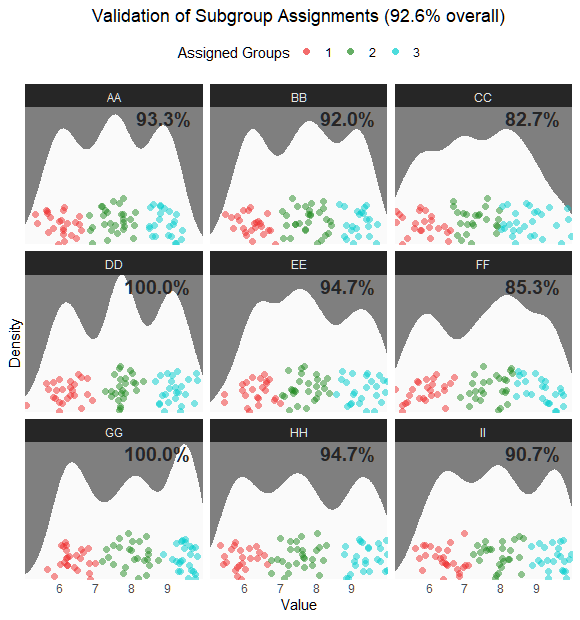
The plot_VALIDATION() function creates a density plot with jittered points colored by assigned group:
# For stratified model
plot_VALIDATION(
  "D:/test/MMR_strat",
  df,
  subpop_col = "Subpopulation",
  value_col = "Value",
  id_col = "ID"
)
# For hierarchical model
plot_VALIDATION(
  "D:/test/MMR_hier",
  df,
  subpop_col = "Subpopulation",
  value_col = "Value",
  id_col = "ID"
)
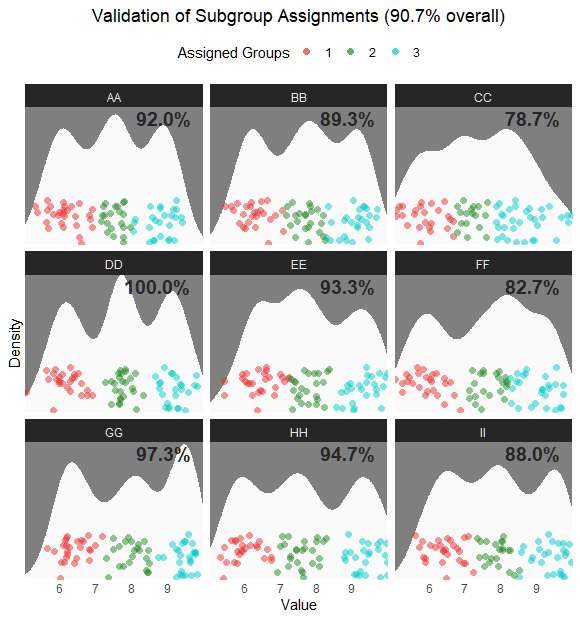
Validation results show accurate subgroup assignments across categories.
| Aspect | Stratified | Hierarchical | Winner |
|---|---|---|---|
| Accuracy | 92.6% | 90.7% | 🏆 Stratified |
| Speed | 12.59s | 104.11s | 🏆 Stratified |
| Parallel | ✅ Yes | ❌ No | 🏆 Stratified |
| Convergence Diagnostics | ❌ No | ✅ Yes | 🏆 Hierarchical |
| Information Borrowing | ❌ No | ✅ Yes | 🏆 Hierarchical |
| Best For | Exploratory, speed | Publication, small categories | — |
Stratified Model:
         Group 1 Group 2 Group 3
  1        209       9       0
  2         16     206      15
  3          0      10     210
Hierarchical Model:
         Group 1 Group 2 Group 3
  1        215      19       0
  2         10     182      10
  3          0      24     215
| Category | Stratified | Hierarchical | Difference |
|---|---|---|---|
| AA | 93.3% | 92.0% | ⬇️ -1.3% |
| BB | 92.0% | 89.3% | ⬇️ -2.7% |
| CC | 82.7% | 78.7% | ⬇️ -4.0% |
| DD | 🏆 100.0% | 🏆 100.0% | ➖ 0.0% |
| EE | 94.7% | 93.3% | ⬇️ -1.3% |
| FF | 85.3% | 82.7% | ⬇️ -2.7% |
| GG | 🏆 100.0% | 97.3% | ⬇️ -2.7% |
| HH | 94.7% | 94.7% | ➖ 0.0% |
| II | 90.7% | 88.0% | ⬇️ -2.7% |
| Mean | 🏆 92.6% | 90.7% | ⬇️ -1.9% |
Metric	         Value
Min ESS	          141
Mean ESS	       253
Max R_hat	       < 1.1 (converged)
| Scenario | Recommended Model | Reason |
|---|---|---|
| Categories are truly independent | Stratified (fuss_PARALLEL_mcmc) |
No information should be shared |
| Categories share the same components |
Hierarchical (fuss_COVARIATE_mcmc) |
Borrows strength across categories |
| Small sample sizes per category |
Hierarchical (fuss_COVARIATE_mcmc) |
Stabilizes estimates |
| Quick exploratory analysis | Stratified (fuss_PARALLEL_mcmc) |
Faster (parallel processing) |
| Publication-quality inference |
Hierarchical (fuss_COVARIATE_mcmc) |
More principled, convergence diagnostics |
| Maximum accuracy (synthetic data) | Stratified (fuss_PARALLEL_mcmc) |
Higher accuracy on this benchmark |
You can also generate custom multimodal data with different parameters:
# Generate custom dataset
custom_data <- MultiModalR::create_multimodal_dummy(
  seed = 12,
  n_categories = 6,
  n_per_group = 30,
  n_subgroups = 4
)
If you use MultiModalR in your research, please cite the original paper: after publication